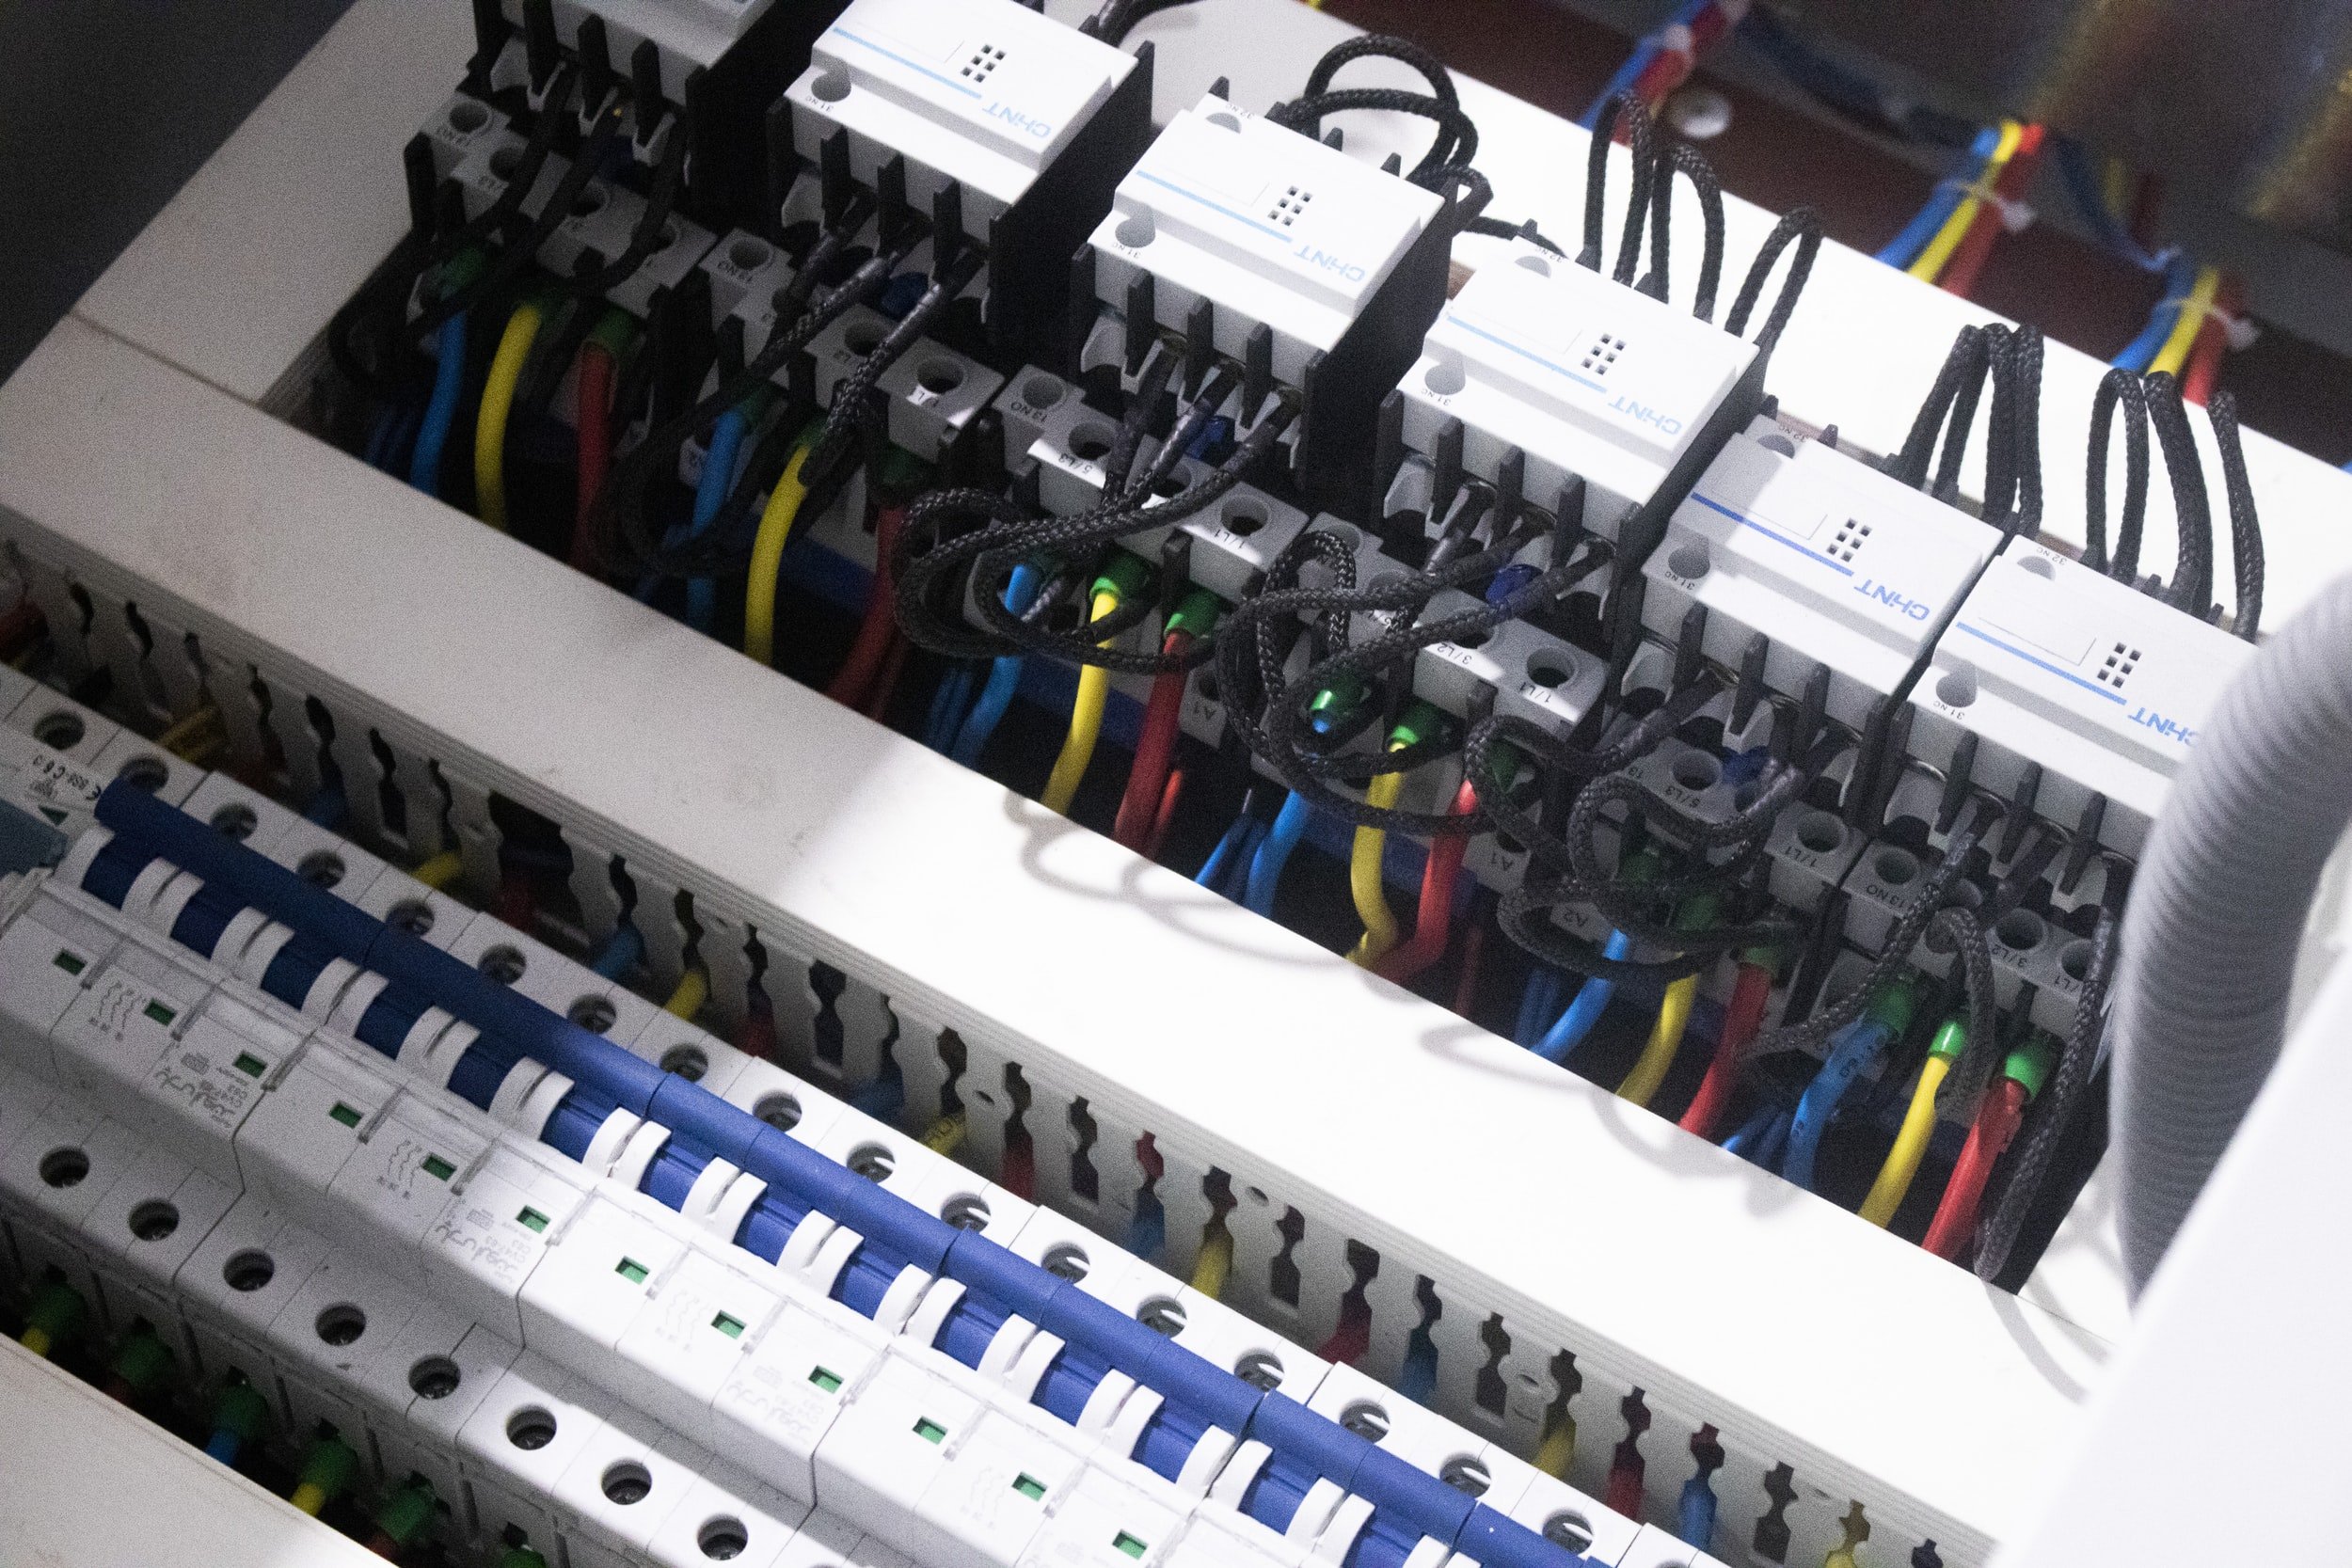
thermography + electrical testing
While "thermo" and "graph" together suggest a "heat picture," true thermography is a sophisticated and powerful diagnostic tool. At Thermavision, we go beyond simply capturing images; we provide a comprehensive analysis of thermal data to uncover hidden issues and prevent future problems.
Our process integrates cutting-edge technology with deep expertise:
Infra Red Detection: We begin by detecting the invisible electromagnetic radiation known as infrared. This is the foundational energy that we analyze.
Advanced Thermal Imagers: Our specialized thermal imaging cameras are designed to capture this infrared radiation with incredible precision, transforming it into a detailed visual "thermogram."
Expert Image Analysis: Our certified technicians meticulously examine these thermograms to identify thermal anomalies—subtle temperature variations that can indicate underlying faults or inefficiencies.
Comprehensive Secondary Measurements: To ensure a complete and accurate diagnosis, we gather additional data points and measurements. This contextual information is vital for a thorough and reliable assessment.
Numerous Calculations: We then perform a series of calculations to quantify and integrate all the collected data. This allows us to provide you with a precise and data-driven understanding of the situation.
This entire process, from initial detection to final analysis, is what we call Thermography. In the hands of our skilled technicians— who are trained and qualified electricians —it becomes an invaluable tool for assessment, prevention, and problem-solving.
What is Thermography? More Than Just a "Heat Picture"
Get in ToucH
Please contact us if you have any questions regarding use of our thermography services.


